“Come quickly – look at the glacier!” urges UC Irvine researcher Isabella Velicogna, running to the bow of the Cape Race to gaze at the massive, crumbling face of Eqip Sermia. She’s stunned by what she sees. “So much is gone since a year ago. All that land over there was covered with ice last time.”
It’s mid-August in Greenland’s North Atlantic fjords. UCI glaciologists and students, joined by a NASA oceanographer and technicians from TerraSond Ltd., are pushing to reach remote glacier faces that are melting at an accelerated rate and to map for the first time the contours of these frigid deeps.
“In Greenland we have melt rates of a few meters a day in the summer months,” says expedition leader Eric Rignot, who – like Velicogna – is an Earth system science professor with a joint appointment at NASA’s Jet Propulsion Laboratory. “And we know the ice sheet is going to melt more and more with climate change.”
If all of Greenland’s mile-thick ice sheet were to melt, it would raise ocean levels worldwide by 21 feet, according to the Intergovernmental Panel on Climate Change – enough to wipe out the coastal homelands of 1 billion people. It may take many centuries or just one; what’s clear is that it’s happening.
Rignot wants to map the glaciers, monitor their march to the sea and set up a warning system for what lies ahead. Last year, for example, the team determined that the Store Glacier is perched on an underwater plateau that keeps it from crashing into the fjord waters – at least for now.
“Of course we are worried about climate change; in fact, I’m more overwhelmed because these things are happening so quickly,” Rignot says. “It’s a time bomb. … We’ve never been through something like this.”
His team, which like Velicogna’s has received worldwide attention in recent years for its findings, is detecting an ominous feedback loop. It appears that Greenland’s ice melt is accelerating because warmer ocean waters are hitting submerged glacier faces well below the cold, freshwater surface. The marine waters shoot upward, bringing heat to a larger portion of the face, which in turn melts down faster. Reaching glacier faces and documenting this process offers critical clues about the detailed mechanisms of the melt.
The researchers are also finding that most fjord bottoms are far deeper than previously thought – plunging as much as 2,000 feet. That means more subsurface ocean heat can flow in and collide with glacier fronts.
It’s not easy gathering such data.
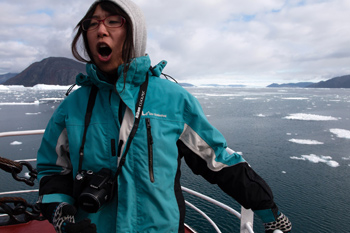
Isabella Velicogna
Greenland is so remote and huge that much of its collapsing 25,000-mile coast has never been mapped. There’s little commerce, few tourists and oil wells. Inuit fishermen know their way through the tortuous fjords, but they pass on this knowledge verbally.
 Rignot and others say precise information is crucial to better predict how fast and where glaciers will give way. They also want to model the physics of saltwater interaction with ice – not just for here, but to use along Antarctica’s mammoth ice sheets. Rignot was the first to report last May that a rapidly melting section of the West Antarctic Ice Sheet appears to be in irreversible decline, with nothing to stop the entire glacial basin from disappearing into the sea.
But East Antarctica is far larger, and little is known about what’s occurring there. New satellite missions by NASA and the European Space Agency help, but that data is large-scale. The researchers want to know exactly where warmer marine water is fingering its way into Greenland and how large a channel it’s entering.
“There’s no other way at present … but by coming with a boat and dropping instruments in the water,” Rignot says.
The team sets out of Ilulissat’s harbor on a fine Monday afternoon: 43 degrees with mostly clear skies and water. They’re treated to a spectacular six-hour Arctic sunset before darkness finally falls but waste little time sightseeing. The boat and work aboard it proceed around the clock; the scientists catch a few hours’ sleep when they can.
There are three major tasks: taking “salinity conductivity, temperature and depth” casts off the port side, mapping the crucial underwater intersection of water and ice off the starboard, and pushing toward outlier “renegade” glacier faces they couldn’t reach in previous years.
By midnight, Rignot is confronting a difficult situation. The ice has piled up so thick in a daunting strait called Torsukattak that boat owner Milos Simovic, inching the 294-ton craft forward, warns they risk getting stuck. A stiff breeze blowing the right way would quickly clear the jammed fjord, but the air is still.
“This looks like a New York City garbage strike!” Rignot jokes to Simovic, who moors the vessel in Brooklyn each winter. “Get the union back on the job.”
A minute later: “Could we really get stuck?”
“Yes.”
The engine shudders into reverse. The next morning, Rignot hits a low point. Like any researcher on a big project, he’s spent months raising funds, acquiring equipment, selecting the crew and seeing to a thousand other details. “These surveys are always a race against time, and we always lose,” he says. “There’s always something to slow us down. There’s never something to make you go faster.”
His mood lightens as he looks out a porthole: “We still have the multi-beam.”
To document the critical intersection where ocean hits glacier, Rignot uses a half-million-dollar “multi-beam” sonar device that bounces sound off the seabed to accurately track depth and formations. Normally, such machinery is strapped safely to a boat’s hull. But Rignot had the crew winch it to the side and tilt it to map glacier faces as well as the sea bottom.
This means the team must work ceaselessly to shove an onslaught of iceberg debris away from the delicate equipment with handmade plastic poles. The closer the boat comes to a glacier that’s disgorging ice, the more frozen hunks the scientists, technicians and crew members must push back. When a patch of clear water appears, they joke, gulp soda or beer, grab a plate of food from the galley and shake out their tired hands before going at it again.
Up on the bridge, a first-ever map of the bottom of the top of the world unfurls on a computer screen a meter at a time.
“I love it! I love being here; it’s so beautiful. And what we’re doing is so important,”
 says UCI doctoral student Cilan Cai, 28, of Tianjin, China, onboard for a second summer. She spends hours on the frigid bow, sizing up approaching bergs and shouting numeric warnings to the polers: 3 means “Relax,” but 4 or above means “Look out!” and 10 means “Stop the boat!”
The last night of the two-week Greenland expedition, the group returns to Torsukattak in a final attempt to reach huge twin glacier faces at its terminus. The boat weaves between bergs the size of houses. Plastic poles poke away ice like a blind person tapping out the route ahead. At 4 miles out, the glaciers appear a hand’s reach away – an Arctic mirage. A maze of ice blocks the path.
Most of those onboard must make harbor in 12 hours to catch planes, including connections for a U.S. troop carrier’s last flight out for the year.
Rignot orders retreat. The multi-beam is pulled up, the battered poles tossed aside on deck. Semisonic’s “Closing Time” floats from the speakers, and the scientists break into spontaneous dance.
They’ve collected comprehensive new data that will help researchers worldwide better understand how ice sheets are melting and how salt water is speeding up the process – information that could be used to persuade policymakers and ordinary people to alter their carbon-busting ways.
“We’re heading toward something that’s not very pleasant, that’s for sure,” Velicogna says. “Do not buy a house too close to the beach!”
In a more serious tone, she adds: “I’m worried that if we just say something terrible is happening, it makes people feel like they don’t want to do anything. I think we should take it as a good challenge. There are a lot of young people with good ideas … that should be tried. We need to just look at this whole thing and try to find … a way to better deal with the changes we’re causing.”
Click to see what UCI researchers are doing at your doorstep.